Do you find it difficult to save money? Perhaps you want to create a $10,000 emergency fund.
You’re not alone; saving money can be a tough row to hoe.
The cost of living is through the roof, and cutting costs on housing, groceries, transportation, healthcare, etc., can be challenging.
Money saving chart is a reliable financial tool to help you save.
Saving charts and printables help you organize and track your expenses, giving you a clear understanding of your expenses and savings.
This blog is about money-saving charts to help you save and hit your goals.
What Is A Money Saving Chart?
A money-saving chart visually represents your financial plans for a specific period or goal.
With a chart, you can note the amount of money to save daily for a particular period.
For instance, you can create a 52-week money saving chart and decide the amount to save each week for that duration.
How Does A Money Saving Chart Work?
A money-saving chart guides you on the amount to put in your nest egg daily, weekly, or monthly.
You must save the set amount on the chart and mark it as done to hit your goal.
52-week saving chart, for instance, requires you to deposit an increment of a certain amount weekly.
A saving chart is akin to a vision board for your money goals.
You can set any amount to start saving and stick to the chart.
Creating a chart is an excellent way to put your financial life together.
It makes saving fun and can push you to achieve financial freedom.
How Hard Is It To Save Money?
Take it easy if you find it hard to stash extra money.
The increase in the price of necessities makes it difficult for many people to save money.
A study shows that 30% of Americans struggle with their finances.
Create saving charts to focus on your saving goals.
The best thing about this strategy is you can have saving charts for various money goals, like vacation funds, emergency savings, house down payment, wedding, etc.
Let’s look at some of the best money-saving charts.
We have printables you can use whether you need to stash away money for a car purchase, a home upgrade, a new baby, a wedding, or a vacation.
Do Money Saving Charts Work?
Yes! A money-saving chart keeps you accountable and focused on your goals.
Nothing feels good than depositing savings and marking your chart as completed.
Seeing your saving kitty numbers grow is the best thing in your financial journey.
Additionally, a money-saving chart can help improve your saving habits.
You’ll be determined to cut unnecessary expenses in your budget.
16 Best Money Saving Charts For Greater Savings
Money-saving charts are easy to use; you can print them out, use spreadsheets, or use a pen and paper.
Make saving fun by printing and sticking your chart wherever you want; your desk, bedside cabinet, etc.
1. 52-Week Saving Chart
Do you want to save money for a significant purchase, Christmas, or a vacation at the end of the year?
The 52-week money saving chart is a simple strategy to save money for a year.
You can start with as little as a dollar.
The idea is to save an increment of a base amount every week for 52 weeks, a year!
For instance, you can start with a dollar the first week, save $2 the second week, $3 the third week, and so forth.
If you decide to start with $10, you’ll save an increment of this amount every week.
Creating a 52 weeks chart is easy!
Write down weeks one to 52, the amount to save each week, and the savings balance.
Add a checkbox at the end of each week, which you can tick once you deposit savings for that period.
Total Savings After 52-Week Saving Challenge
If you start with a dollar, you’ll have $1,378! A $10 challenge for 52 weeks will create a nest egg of $13,800!

Pro Tip: Stick your printable chart where you can see regularly as a reminder to save. Set notifications or automate your savings if using an app or a digital chart.
2. 26-Week Saving Chart
The biweekly, aka the 26-week money saving chart, is another straightforward money-saving strategy to boost your savings. Instead of depositing savings every week, you can do so every other two weeks.
This saving chart can be perfect if you want to save for six months or every two weeks for the year.
You can have savings worth $1,378 in six months!
Do you want to save $3,510 in six months?
Use our 26-week money-saving chart and start with $10 the first week.
Total Savings After 26-Week Saving Challenge
You’ll have $3,510, saving an increment of $10 for 26 weeks or six months!

Pro Tip: You can consider saving every two weeks so you don’t strain your income. Also, it’s okay to start with a small amount; it will compound.
3. Monthly Expense Tracker
“Where does my money go?” Ring a bell? Well, keeping track of our income can be challenging.
A monthly expense chart is an excellent tool to help you track your monthly expenses.
Use the 50/30/20 rule to track your monthly budget. 50% of your paycheck caters to basic needs.
Put 30% towards wants and 20% towards your debt and savings.

4. Kids Saving Tracker
How should your kids save their money?
Teaching kids to save can go a long way in their financial life.
A kids’ savings chart can help visualize their goals.
Set the start and end date, saving goal, and amount.
Snag our kids’ money-saving chart and create fun money-saving moments with your kids.
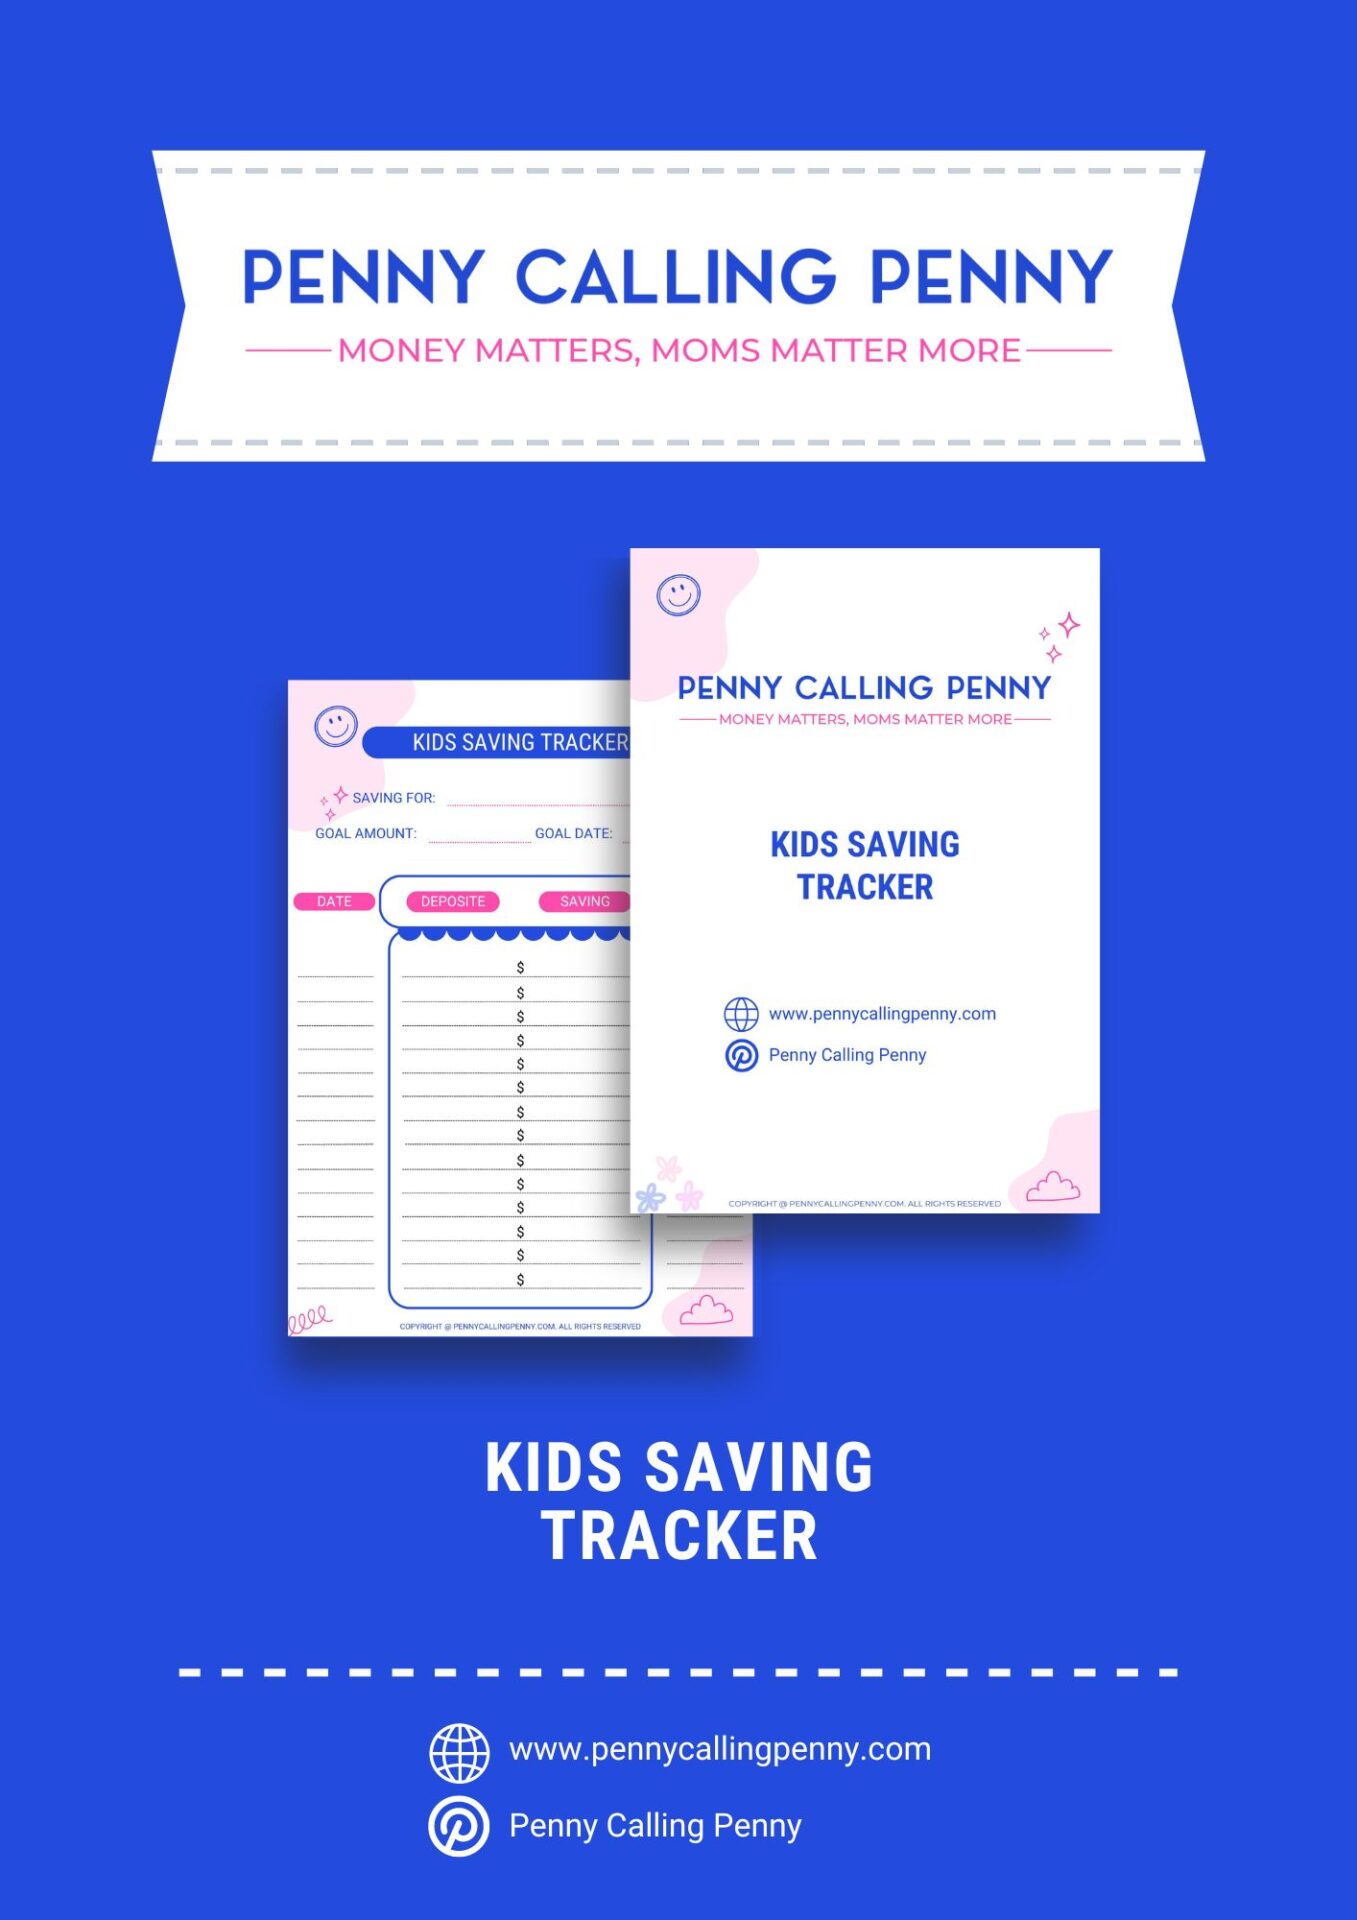
Pro Tip: Provide a clear jar or a piggy bank with a digital counter for kids to save!
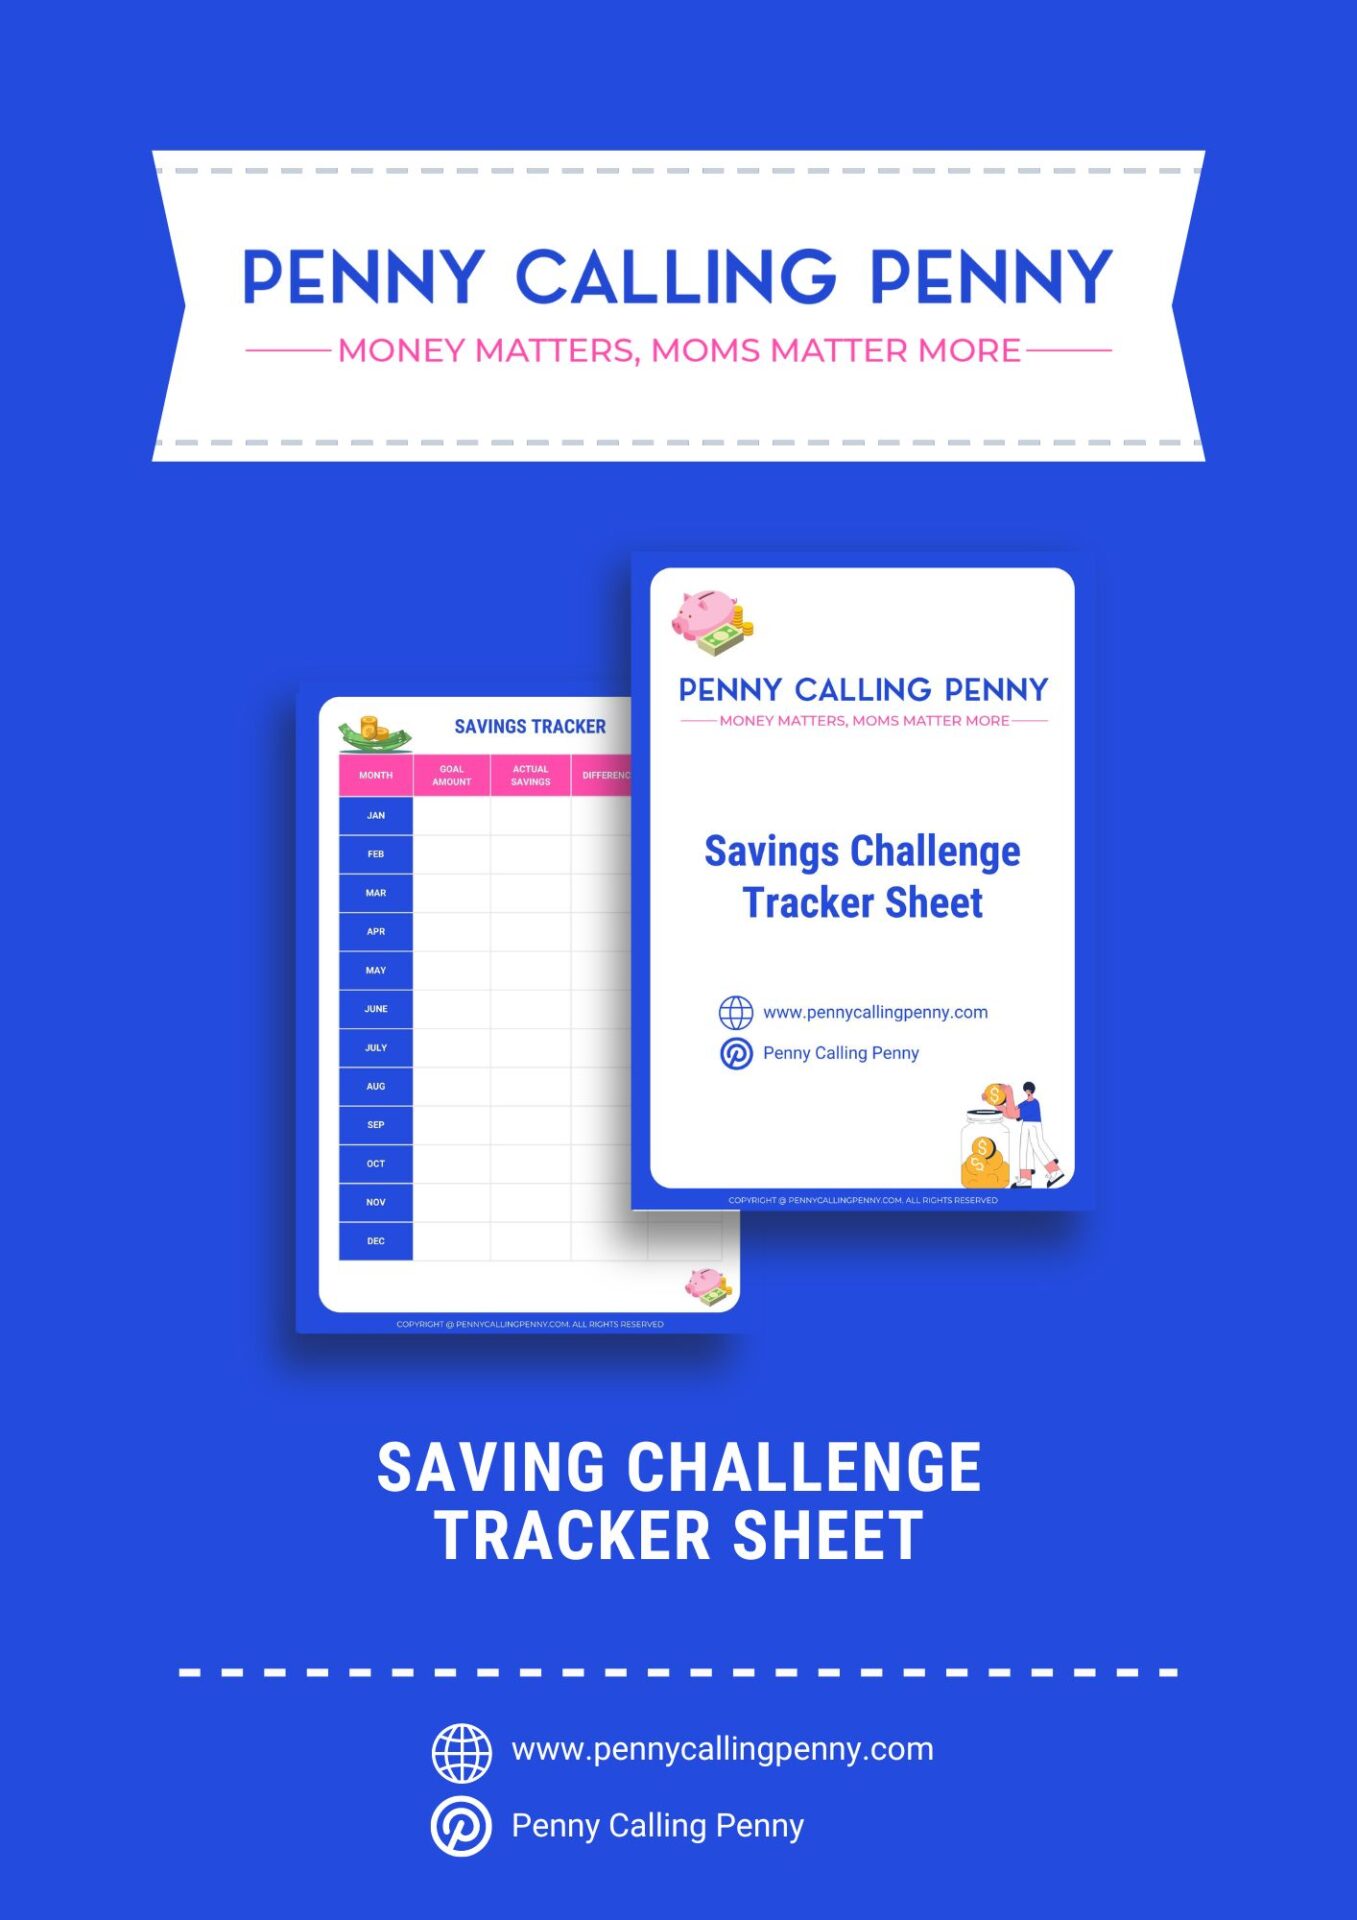
5. Savings Tracker
Do you track your savings?
A savings tracker helps you understand how much you’ve saved so far.
You can also check how much more you must stash to hit your saving target.
Creating a savings tracker chart is simple.
List the days, weeks, or months you want to save and the goal for that day/week/month.
Note the actual savings, the difference, and notes.
6. $10,000 Saving Chart
Having $10k in savings can make a huge difference.
A money-saving chart is helpful if you want to save this much for a specific period.
Break down this amount into daily, weekly, and monthly savings.
Deposit $28 daily, and you’ll have $10,220.
If you save weekly, you’ll need to stash at least $192 weekly for 52 weeks.
Saving $10,000 is possible when you have the right strategy.
Create a weekly or biweekly saving chart for your $10k saving challenge.

Pro Tip: You can choose between the daily, weekly, biweekly or monthly saving challenge to hit your $10k target.
7. Monthly Savings Thermometer
Tracking your savings with a Monthly Savings Thermometer provides a clear visual representation of your progress toward financial goals, offering motivation and accountability as you watch your savings grow each month.

8. Expense Categories Pie Chart
The Expense Categories Pie Chart is crucial for budgeting mastery, enabling you to understand and allocate your spending efficiently.
This visual breakdown empowers better financial decisions, ensuring a balanced and informed approach to managing your finances.

9. Debt Snowball Tracker
Utilize the Debt Snowball Tracker to systematically eliminate debts.
This tool not only helps you visualize your debt reduction journey but also fosters a sense of accomplishment as you methodically pay off smaller debts and gain momentum towards financial freedom.

10. Weekly Savings Log
A Weekly Savings Log adds structure to your saving habits by providing a detailed record of your contributions.
This tool aids in consistency, helping you stay on track and build a healthy savings routine over time.

11. Coupon Savings Tracker
The Coupon Savings Tracker is essential for maximizing your budget.
By monitoring the savings generated through coupons, you gain insight into cost-cutting opportunities, contributing to overall financial health and resourcefulness.

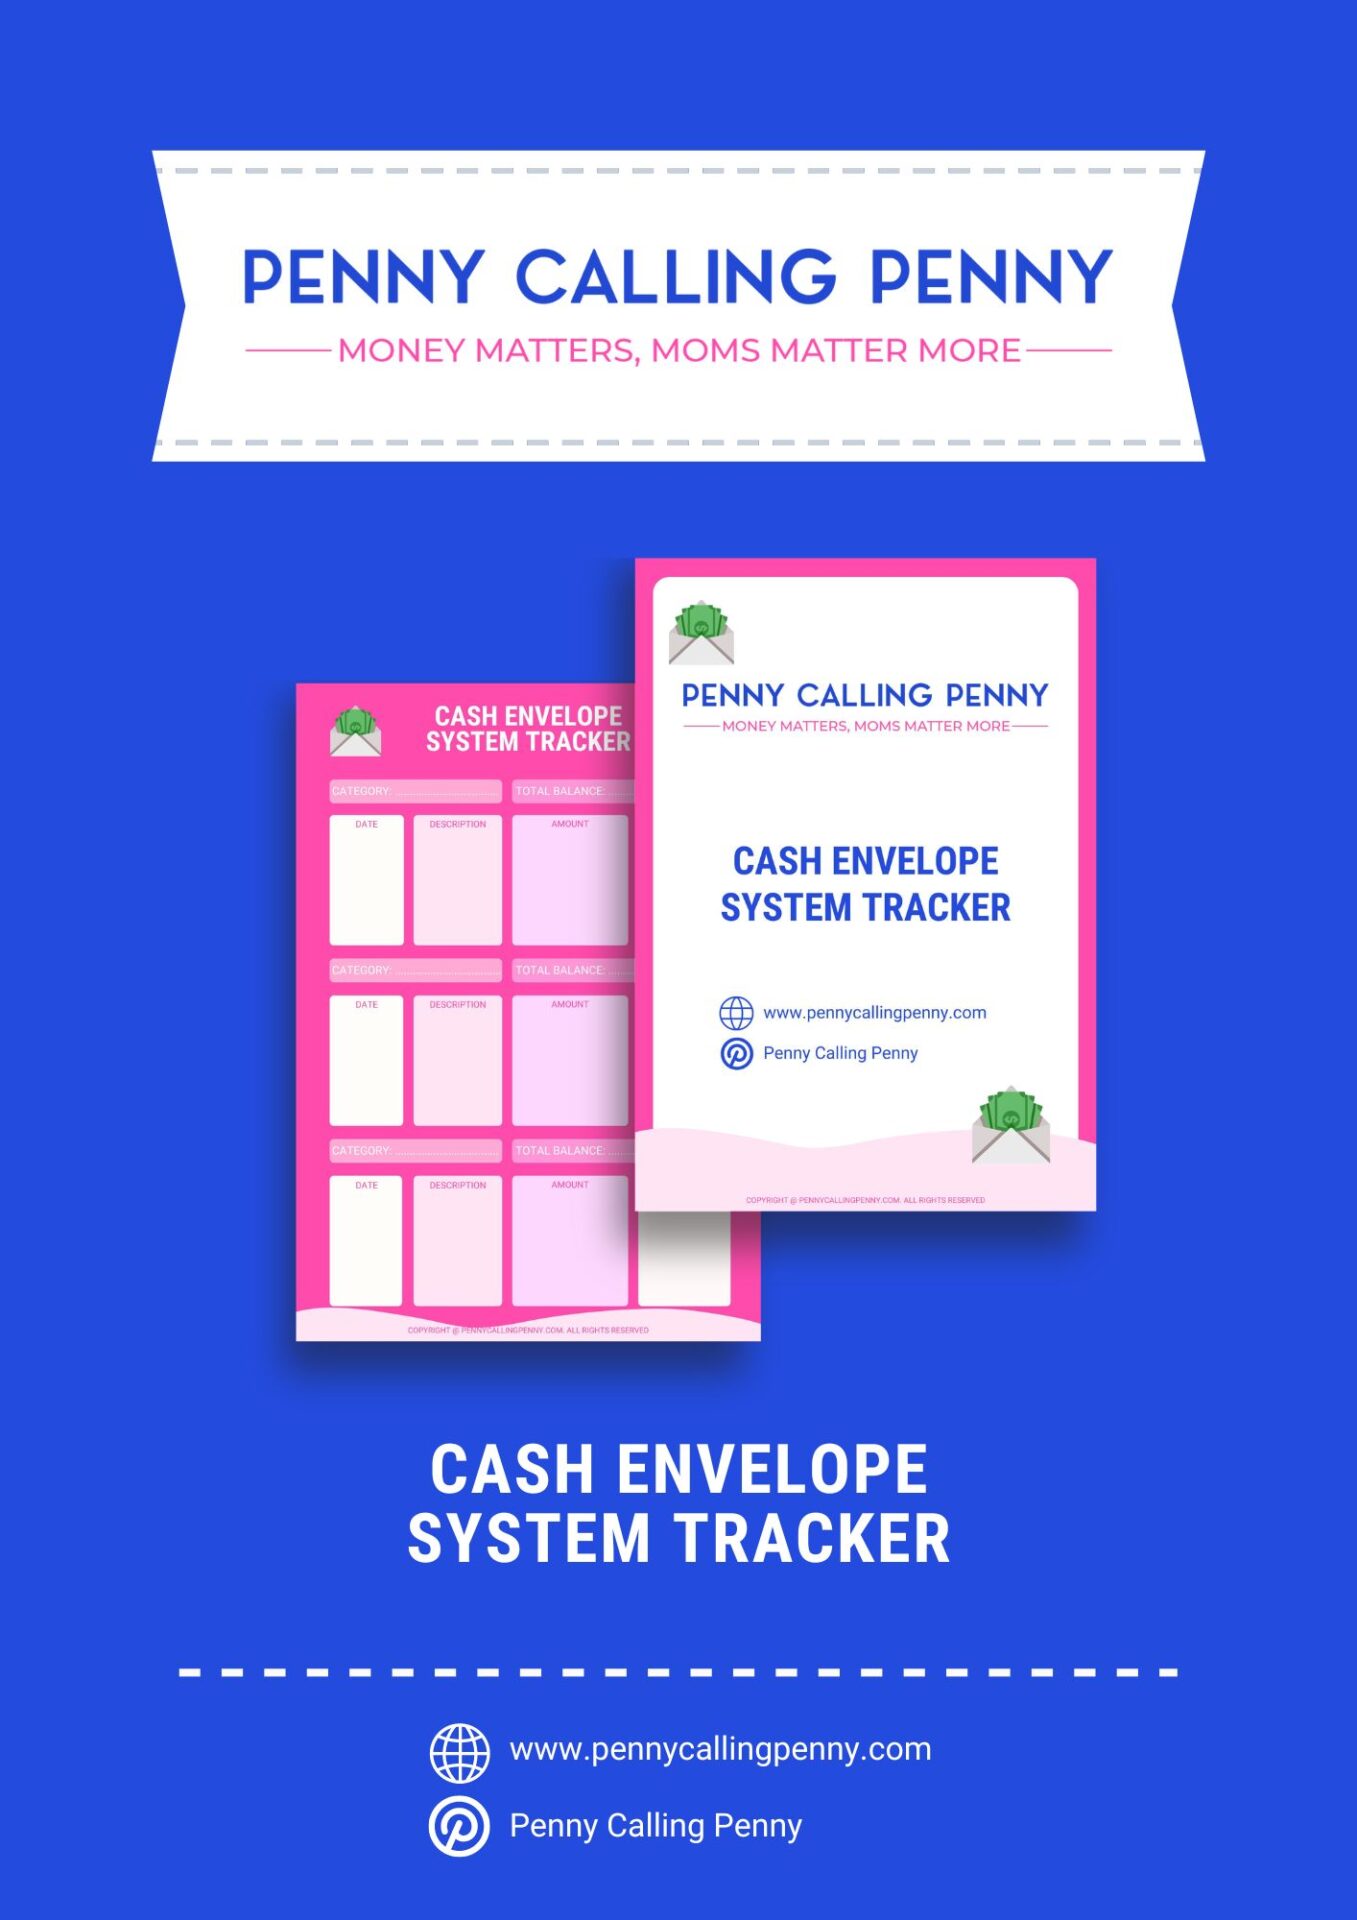
12. Cash Envelope System Tracker
Implementing the Cash Envelope System Tracker ensures disciplined spending within predefined categories.
This visual aid promotes financial mindfulness, preventing overspending and encouraging a cash-centric approach to budget management.
13. Interest and Dividend Earnings Chart
The Interest and Dividend Earnings Chart showcases the growth of your investments over time.
Monitoring these earnings provides a comprehensive view of your wealth-building journey and encourages strategic investment decisions for long-term financial success.

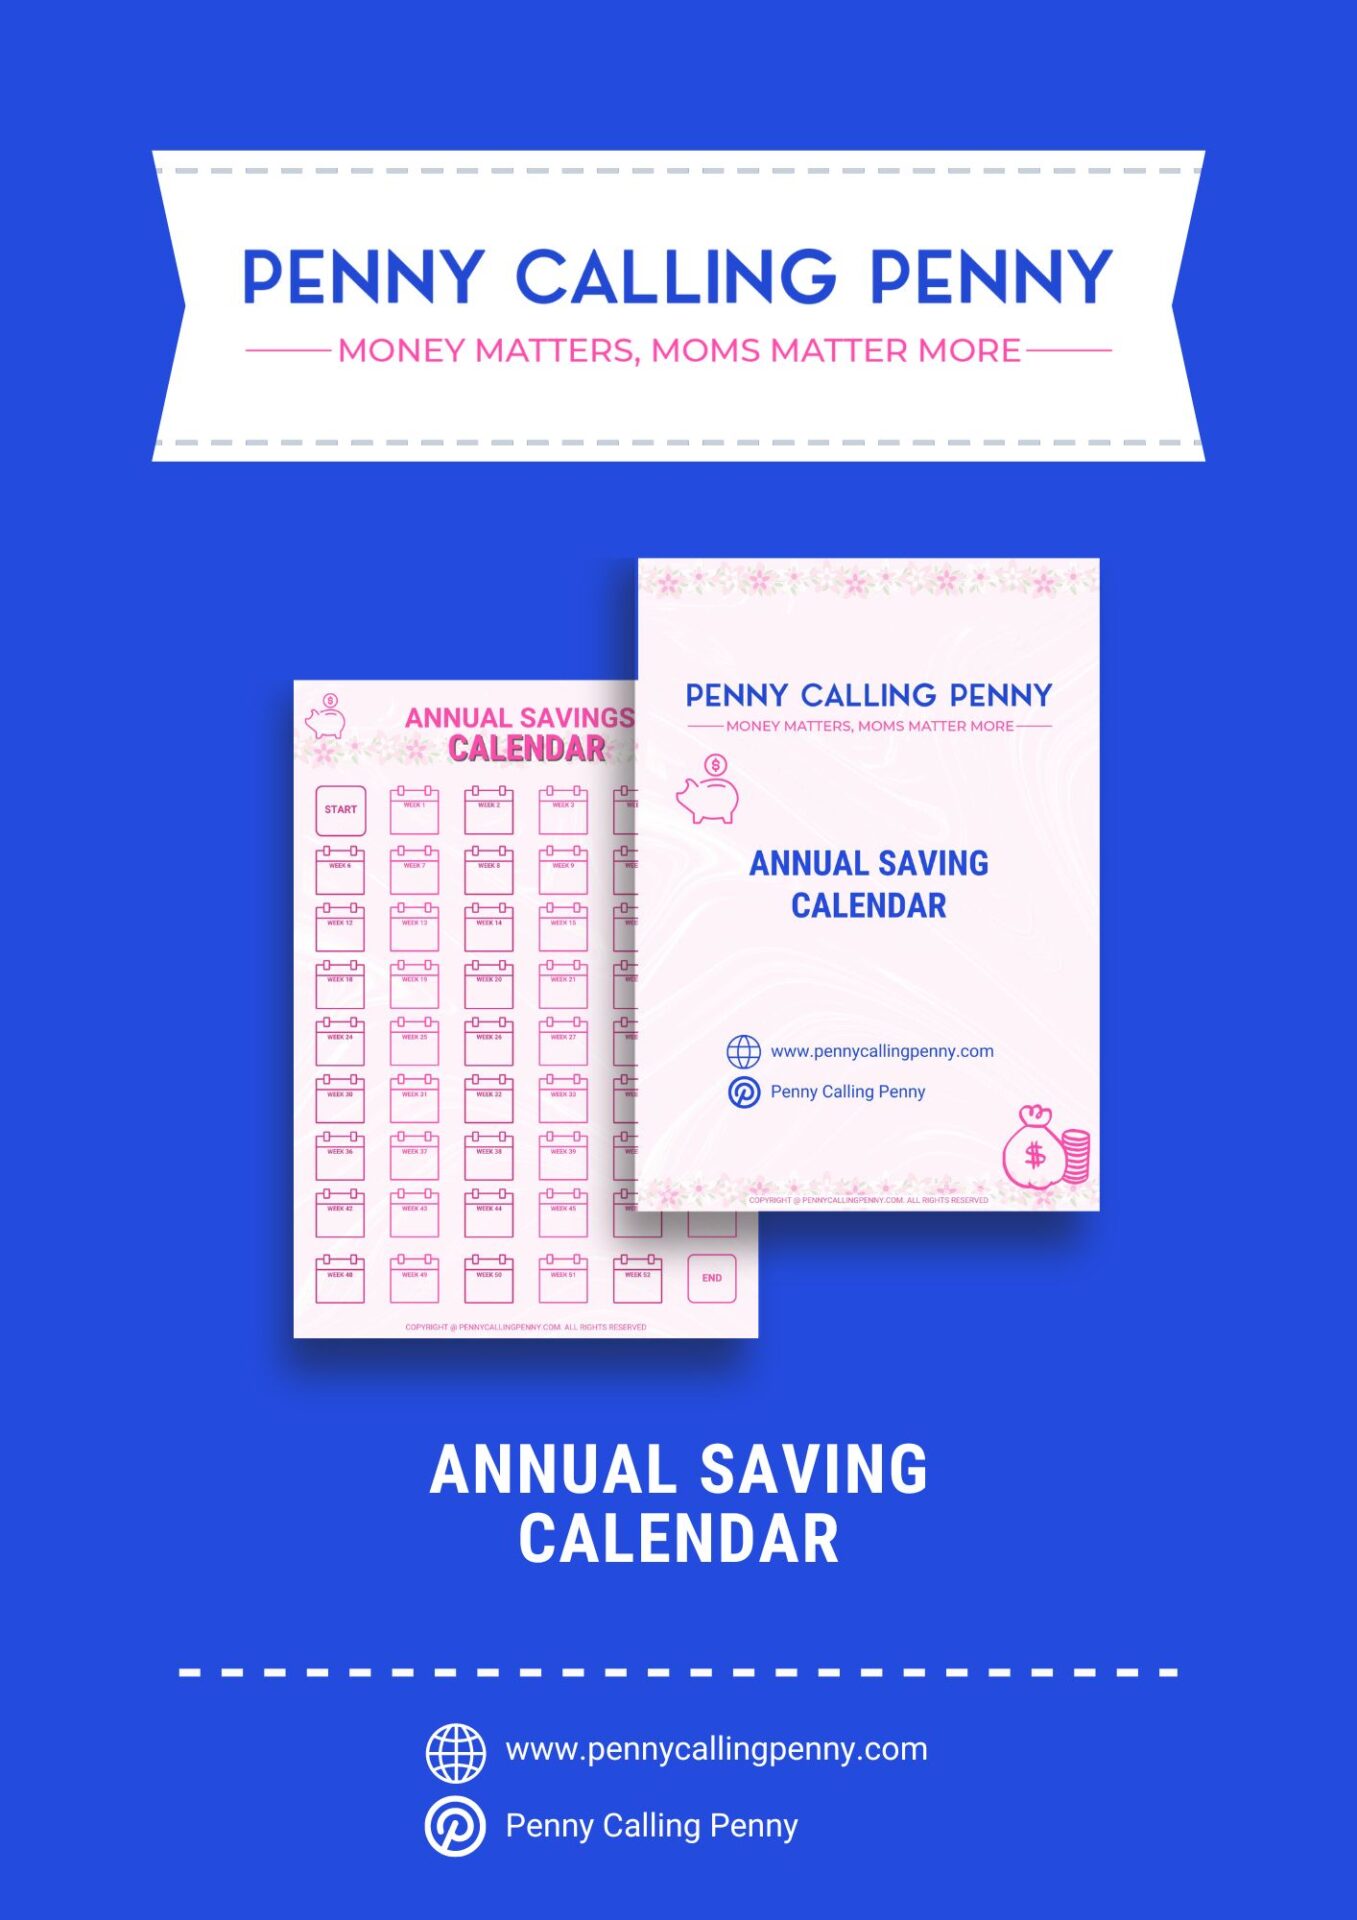
14. Annual Savings Calendar
An Annual Savings Calendar serves as a strategic planning tool, helping you set and achieve savings goals throughout the year.
This visual roadmap enhances financial foresight and ensures a systematic approach to meeting both short and long-term objectives.
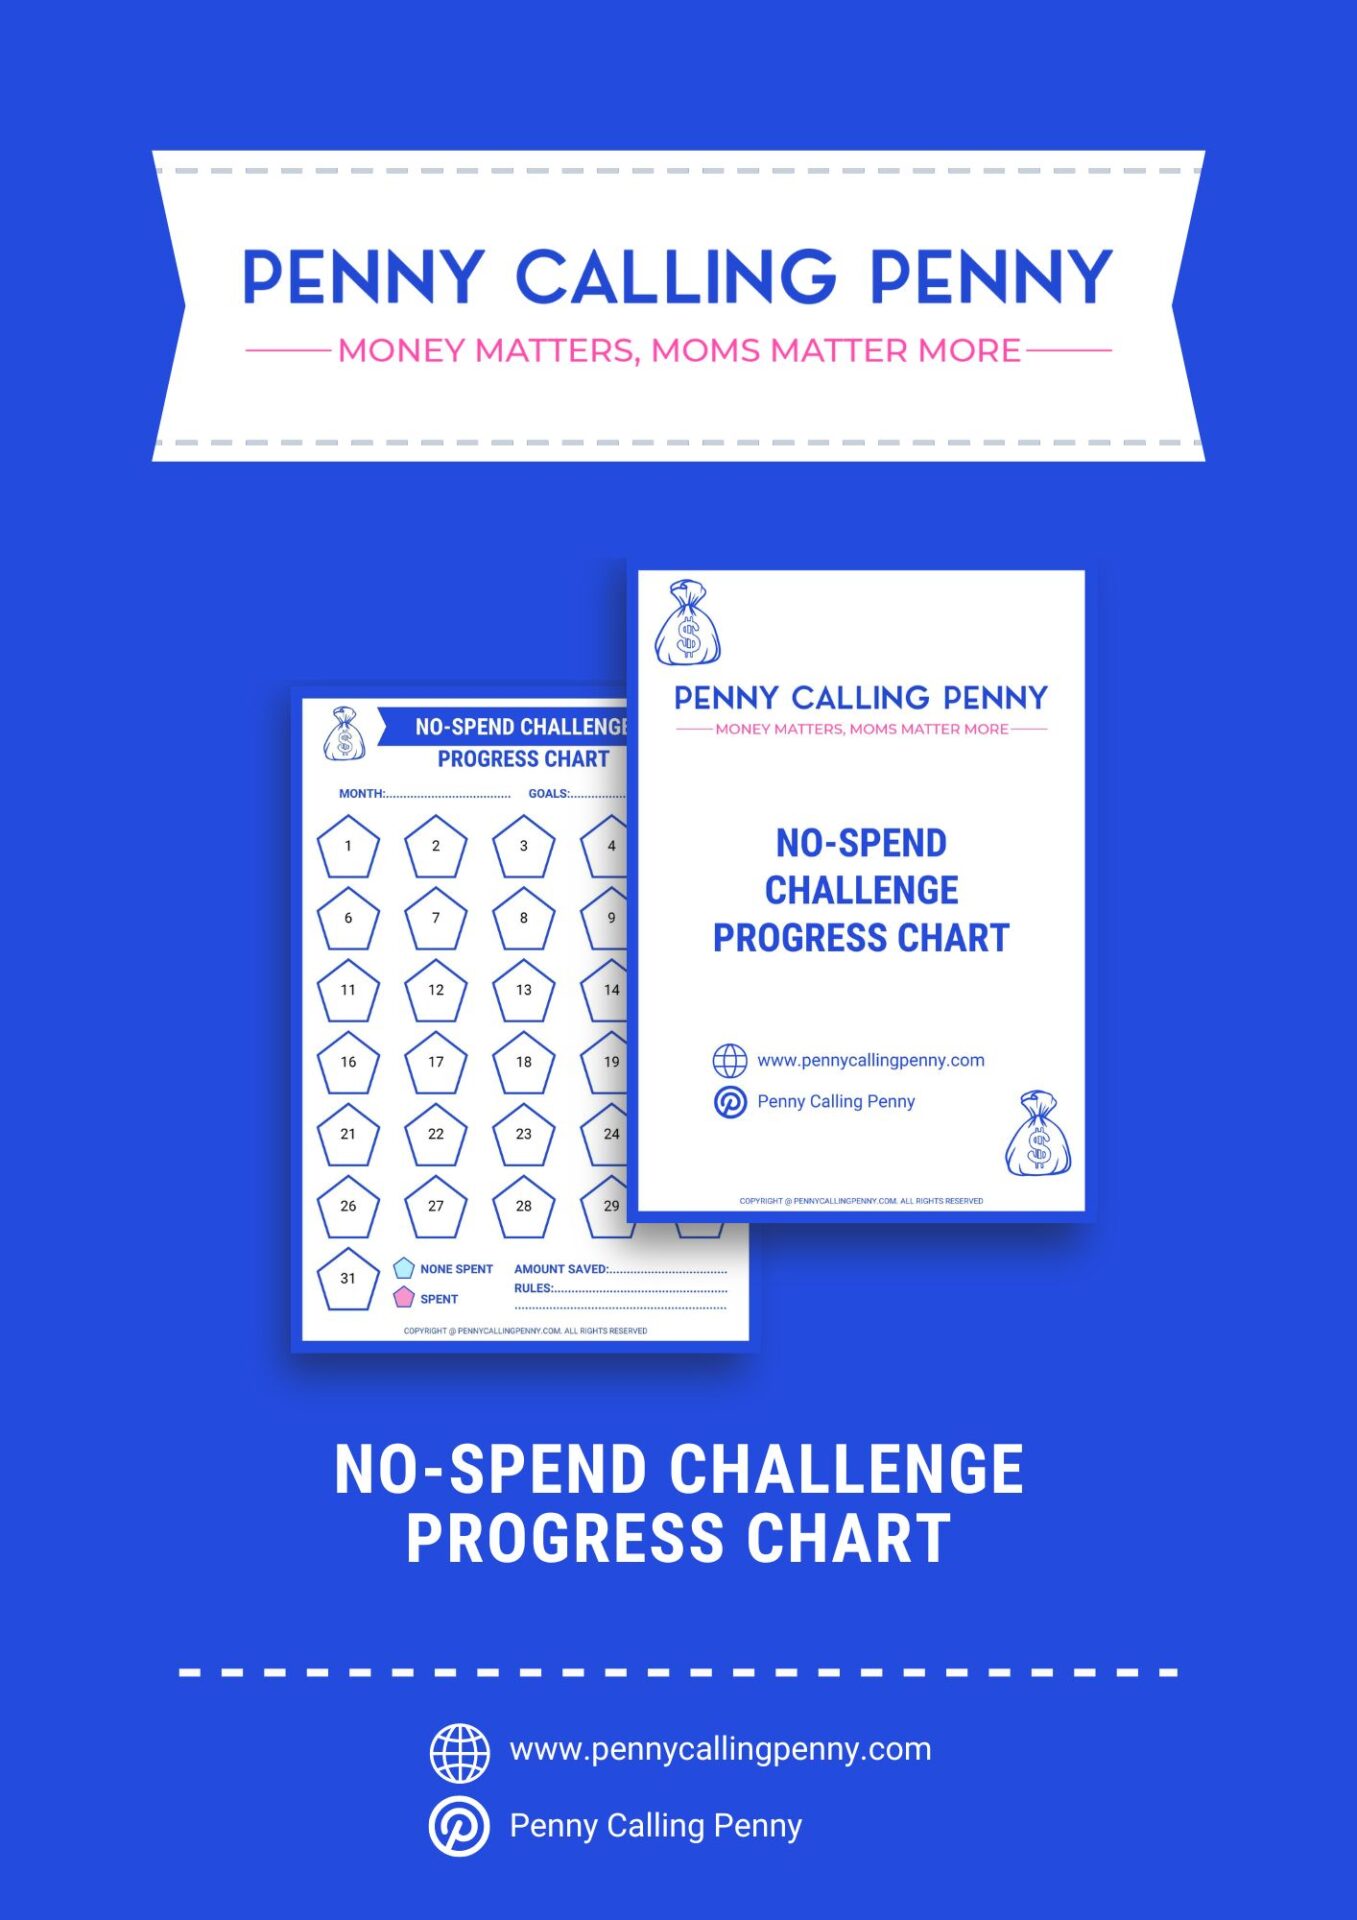
15. No-Spend Challenge Progress Chart
Engaging with a No-Spend Challenge Progress Chart cultivates mindful spending habits.
Tracking your progress reinforces self-discipline, fostering a sense of accomplishment as you successfully navigate periods of restrained spending.
16. Rainy Day Fund Tracker
The Rainy Day Fund Tracker is indispensable for building a financial safety net.
Monitoring the growth of your emergency fund provides peace of mind and financial security, ensuring you’re well-prepared to handle unforeseen expenses or emergencies.

Conclusion
Saving money is easier when you add fun to the mix.
The first step is to understand your saving goal.
Are you saving for college, a house, a car, a holiday, or a wedding?
Once you know the amount to save, pick a timeframe and create a saving chart.
Find this helpful? Share it on Pinterest, LinkedIn and Facebook for your dear ones. Also, subscribe to our newsletter to receive articles like these straight to your inbox.
Did you take our Reader Survey? If not, it only takes 1 minute and you can take our survey here.
FAQs
Monitoring your progress is essential. You can track your savings using a chart, an app, or a budget rule.
Setting an achievable goal is simple. Know the amount you want, where to save, and a deadline. You can use a high-yield savings and checking account, treasury bills, certificate of deposit, money market account, etc.
Many saving apps like PocketSmith, and Chime have options to track and calculate your savings.


